Track the usage of a Design System
Whether it’s for lead management or for you to understand how it is used, tracking the usage and coverage of your design system is essential to its success.
In this article, I will detail the tracking system we had, the data collected, how it was retrived, and maybe most importantly, the reasons and ways this data was used.
The result
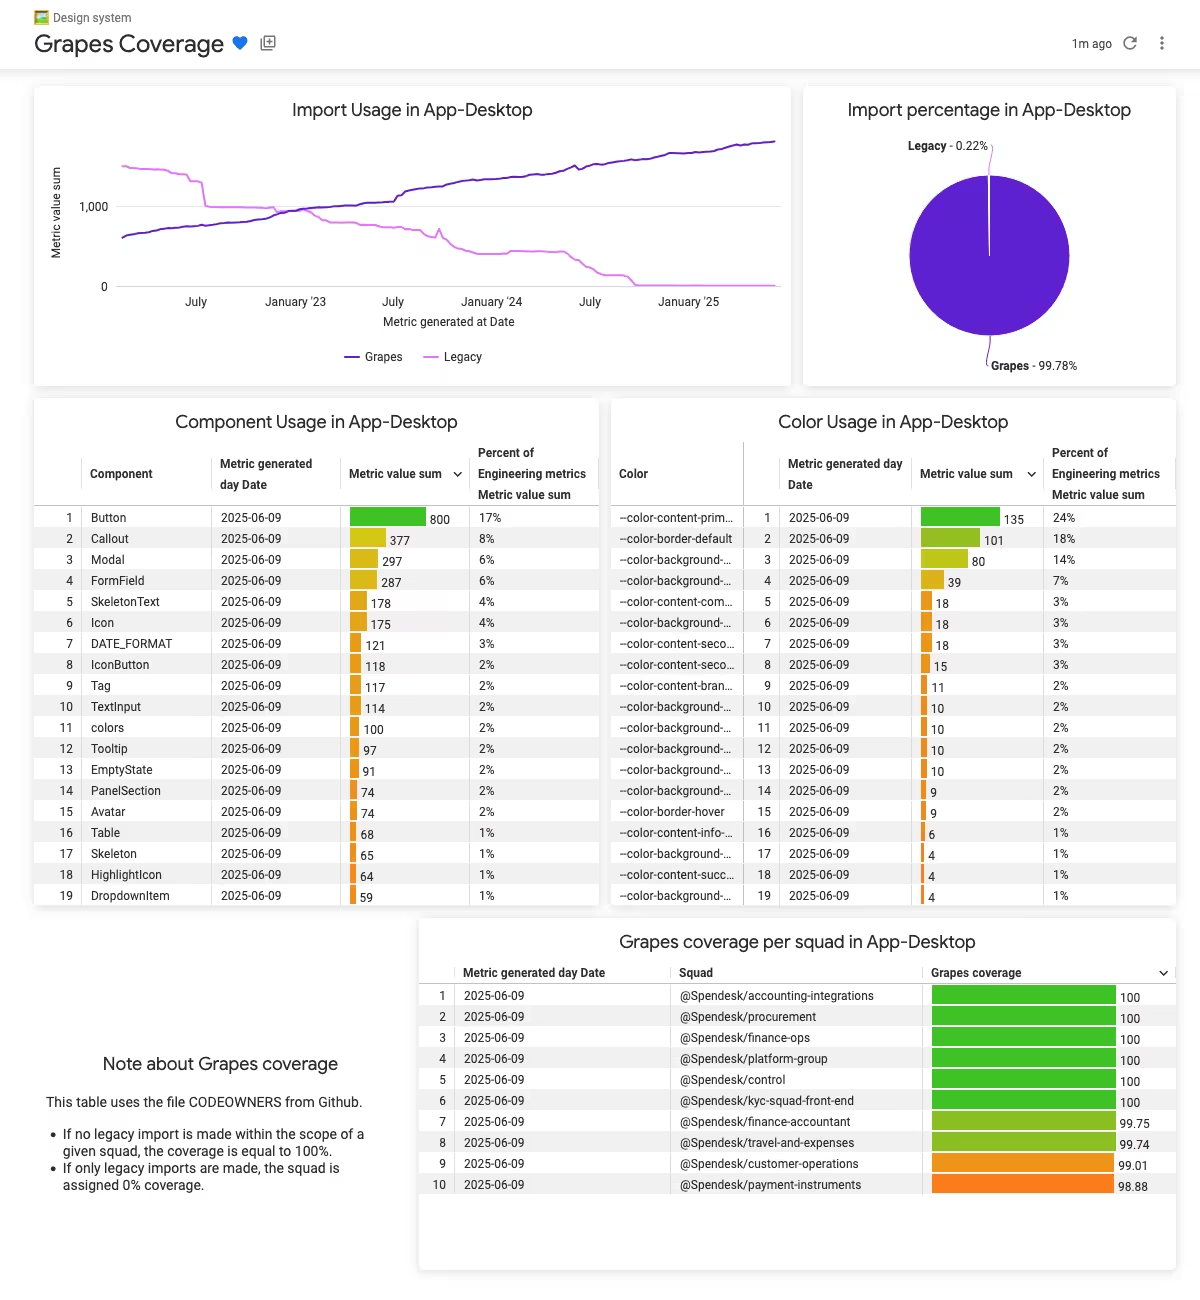
I will start at the end. This is what our coverage and usage dashboard looks like:
The first version was very very far from this, so let’s go back to the beginning.
The beginning: Why
The design system at Spendesk began as a side project initiated by a designer and a developer back in 2020. In 2021, another developer and I took ownership and we worked on it in our spare time.
However, as months passed, this spare time felt more and more insufficient. I didn’t have time to complete my task and support requests and bug took more and more time. I didn’t have any data to support my concern so I created a very simple script to compare the number of imports from our Design system, known as Grapes, against a collection of common components used in the main product. The results were then integrated into Looker, leading to the creation of the first graph in the screenshot above: ‘Import Usage in App-Desktop’1.
The idea behind this script was to prove that Grapes wasn’t just a side project anymore and needed appropriate ressources.
Unfortunately, I no longer have the original code for this script (it was written over three years ago), but it was something like this:
function getImportInFile(fileContent: string) {
  // Identify import from the Design System named Grapes
  const grapesMatch = fileContent.match(
    /from\s["']@dev-spendesk\/grapes["']/im
  );

  const grapesScore =
    grapesMatch === null ? 0 : 1;

  // Identify import from the collection of common component
  const legacyMatch = fileContent.match(
    /component\/legacy["']/im
  );

  const legacyScore =
    legacyMatch === null ? 0 : 1;

  return { grapesScore, legacyScore}
}
For each file, the script invoked the function getImportInFile. This function returned an object containing the count of imports for the design system and the common components, here named “legacy”.
The initial results showed that around 25% of the imports for a component came from our design system. This was huge! And so, it enabled me to request and secure more time to work on the design system.
Track usage
Our design system grew and breaking changes were frequent. To asses the complexity of a breaking change, we needed to understand how a given component was used and how often.
So I went back to my tiny script and added some lines to track not only the imports but also what was being imported.
function getImportInFile(fileContent: string) {
  // Identify import from the Design System named Grapes
  const grapesAdvancedMatches = fileContent.match(
    /import\s{(?<import>[\s\w,]+)\n?}\sfrom\s["']@dev-spendesk\/grapes["']/im
  );

  const grapesScore =
    grapesAdvancedMatches === null
      ? { grapes: 0, components: [] }
      : {
          grapes: 1,
          components: importMatchesToComponents(
            grapesAdvancedMatches.groups?.import
          ),
        };
}
The regex has become a little bit more complex. Components imported are placed under a named group called “import” (I know, quite original). grapesScore is no longer a number but an object that includes the score but also the list of imported components reshaped by the function importMatchesToComponents.
This function was only designed to format the named group “import” to something usable by Looker.
function importMatchesToComponents(
  importMatches: string | undefined
) {
  if (!importMatches) {
    return [];
  }

  // Extract component name and return a list of identifiers
  return importMatches
    .split(",")
    .map((str: string) => str.trim())
    .filter((str: string) => str.length > 0)
    .map(
      (componentName) =>
        `grapes-metrics-component-${componentName}`
    );
}
It’s important to note that the script did not report the number of instances of a component but rather how many times a component was imported.
import { Button } from '@dev-spendesk/grapes';

export function Toolbar() {
  return (
    <div>
      <Button onClick={something()} variant="primaryBrand">
      <Button onClick={somethingElse()} variant="primaryBrand">
    </div>
  );
}
In this example, the component Button is imported once but used twice, and the script would have reported 1.
It’s not perfect but it’s way easier to implement and was enough for our needs.
Then, this table came to life:
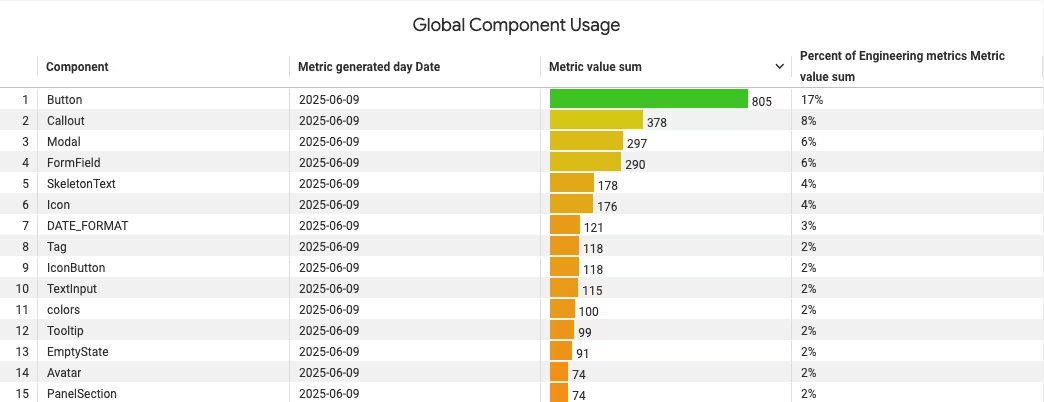
As expected, the top three components by usage are: Button, Callout and Modal. We love Modal at Spendesk!
Track coverage per team
In 2024, a huge rebranding is annonced with the design system at its core. At that time, 75% of component imports came from the design system. To ensure the success of the rebranding, we aimed to increase this percentage as close to 100% as possible.
To allocate resources effectively, it was crucial to identify which team had the lowest score, meaning the ratio between legacy imports and design system imports.
So, for the last time, I came back to the script and updated it to return the coverage per team. The idea was simple: use GitHub’s CODEOWNERS file to assign a file (and its associated score grapes/legacy import) to a team.
Given the importance of this data, it was also time to refactor this script, moving it from a hackathon type of code to something more robust and maintainable.
const analyze = (context) => {
  const { prevState, fileName, folder } = context;
  const contentString = readFile(fileName);
  const { legacy, grapes, components, legacyComponents } =
    getImportInFile(contentString);

  const squads = foldersBySquad.get(folder);
  squads?.forEach((squad) => {
    if (prevState.squadsScore[squad]) {
      // A score already exist
      prevState.squadsScore[squad].legacy += legacy;
      prevState.squadsScore[squad].grapes += grapes;
    } else {
      // Create a new score object
      prevState.squadsScore[squad] = { legacy, grapes };
    }
  });

  // [...]
};
This is a preview of the main function analyze. There is still the function getImportInFile and the score is now used to update a squadsScore object.
For a given file, we can compare its full path against values in GitHub’s CODEOWNERS file, which will give us the squad or squads responsible for it. This is what we have inside the Map foldersBySquad.
Once we have this information, we either increment the score for each squad or create a new score object. All of this data is then sent to Looker.
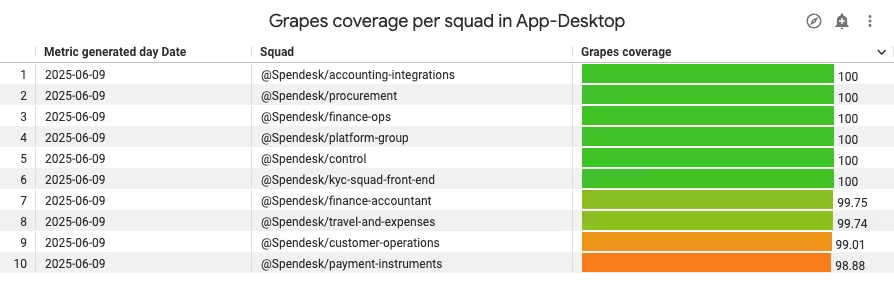
The outcome was something like this (Obviously, before our effort to target 100%, not every team had a score > 98%)
Conclusion
Tracking the usage and coverage of the design system began as a means to better support the design system and dedicate more time to it. As the project grew, so did the script, and with the rebranding of Spendesk, it became a central piece for roadmap planning, resource management, and decision-making.
We had many more ideas for this dashboard, such as tracking component variants, trying to identify and count workarounds, or counting the actual number of instances of a component (rather than its import).
However, with Spendesk’s rebranding complete and the goal of 100% coverage done, Spendesk’s priorities shifted, and the Design System no longer has the resources it once had, putting a pause on this tracking initiative.
Footnotes
-
App-Desktop is the name of the frontend project at Spendesk and is the primary consumer of our design system. ↩